Mitigating and Adapting to Climate Change
The Sixth Assessment Report of the Intergovernmental Panel on Climate Change (IPCC) states that “it is unequivocal that human influence has warmed the atmosphere, ocean and land.” In 2023, parts of the world experienced heatwaves, leading to the highest average summer temperatures ever recorded globally, a phenomenon that was described as “The era of global boiling has arrived.” With countries declaring their intentions to achieve net-zero CO2 emissions and carbon neutrality, the movement driving society’s transition to a decarbonized society is gaining momentum, which certainly indicates that the initiatives of individual companies to reduce greenhouse gases are growing increasingly important.
The Kubota Group sees “Mitigating and Adapting to Climate Change” as one of its materiality and is committed to the challenge of achieving carbon neutrality by 2050. It has been advancing initiatives toward the “mitigation” of climate change by reducing greenhouse gas emissions mainly through energy-saving activities and the introduction of renewable energy sources and “adaptation” to be prepared for the impact of climate change.
- Activities towards achieving SDGs
- Long-Term Environmental Conservation Targets 2030 and the Results
- Medium-Term Environmental Conservation Targets and the Results
- Mitigation of Climate Change
- Adaptation to Climate Change
Activities towards achieving SDGs
| Related SDGs and targets |
 |
|---|---|
| Major Activity Content |
|
| 2030/2025 Activity Targets (KPIs) |
|
Long-Term Environmental Conservation Targets 2030 and the Results
| 2030 Targets | Reduce CO2 emissions from the Kubota Group* by 50% compared to the base year 2014. |
|---|---|
| Result | In FY2023, CO2 emissions of the Kubota Group* were reduced by 28.0% compared to the base year FY2014. |
- CO2 emissions refer to Scope 1 and 2 emissions from all Kubota Group sites (100%) and include greenhouse gases from non-energy sources
Medium-Term Environmental Conservation Targets and the Results
| Actions items | Management Indicators*2 | Base FY | Targets for FY2025*4 | Targets FY2030*4 | FY2023 Results |
|---|---|---|---|---|---|
| Reduce CO2*1 | CO2 emissions per unit of production (Scopes 1, 2) | 2014 | ▲45% | ▲60% | ▲46.6% |
| Ratio of renewable energy usage*3 | — | 20% or more | 60% or more | 15.9% | |
| Save energy | Energy consumption per unit of production | 2014 | ▲35% | ▲40% | ▲37.8% |
- *1.CO2 emissions indicate 90.6% of base-year Scope 1 and 2 emissions and include greenhouse gases from non-energy sources. We use the emissions coefficient for electric power of the base year in our calculation of CO2 emissions from energy sources.
- *2.The figures per unit of production represent the intensity of the environmental load per unit of money amount of production. The exchange rate for FY2014 is used when translating the money amount of production of overseas sites into Japanese yen.
- *3.The applicable boundary is global sites.
- *4.▲ indicates a negative figure.
Mitigation of Climate Change
1.CO2 Emissions (Scope 1 and Scope 2)
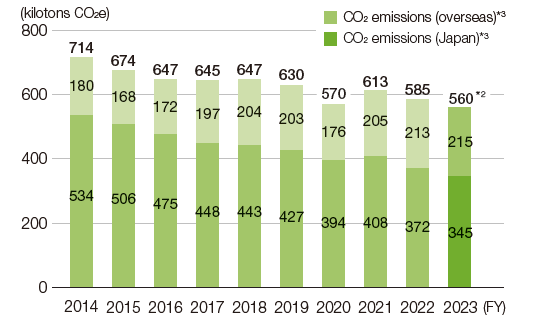
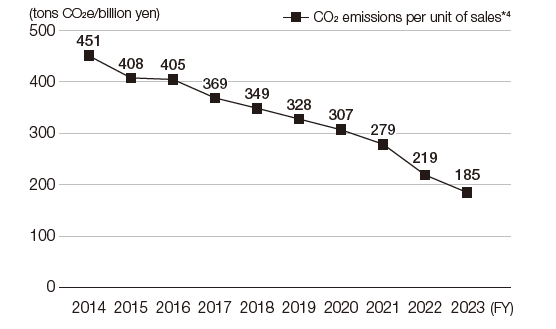
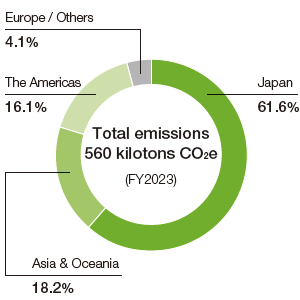
In FY2023, CO2 emissions were 560 kilotons CO2e, a decrease of 4.3% compared to the previous year. On the other hand, CO2 emissions per unit of sales improved by 15.2% compared to the previous year.
CO2 emissions decreased due to implementation of reduction measures and reduced production at casting production sites, despite worsening emission factors associated with electricity usage.
Emissions per unit of sales improved due to an increase in consolidated sales and by promoting CO2 reduction measures such as expanding the use of renewable energy, promoting energy conservation activities, and installing high-efficiency equipment.
-
Trends in CO2 Emissions*1 and Emissions Per Unit of Sales
- *1. The CO2 emissions for companies acquired or sold that have a significant impact on the Group’s overall CO2 emissions have been retroactively adjusted to before the acquisition or sale. The adjusted values are: 778 kilotons CO2e in FY2014, 739 kilotons CO2e in FY2015, 700 kilotons CO2e in FY2016, 688 kilotons CO2e in FY2017, 693 kilotons CO2e in FY2018, 672 kilotons CO2e in FY2019, 614 kilotons CO2e in FY2020, 660 kilotons CO2e in FY2021, and 595 kilotons CO2e in FY2022. In FY2023 we had no acquisitions or sales subject to adjustments.
- *2. CO2 emissions (560 kilotons CO2e) include portions of CO2 that were not released into the atmosphere but absorbed as carbon into products such as iron pipe (14 kilotons CO2e).
- *3. CO2 emissions refer to Scope 1 and 2 emissions from all Kubota Group sites (100%) and include greenhouse gases from non-energy sources.
- *4. CO2 emissions per unit of consolidated net sales. The Kubota Group adopted International Financial Reporting Standards (IFRS) instead of accounting principles generally accepted in the United States of America from FY2018.
2. Measures to Reduce CO2 Emissions
The Kubota Group has established the Medium- and Long-Term Environmental Conservation Targets (p.26-28) and is devoting efforts to reducing CO2 emissions and energy use associated with its business activities.
We have also established medium-term reduction measure implementation plans, which are reviewed every year by each production site. When we review the plans, we have introduced Internal Carbon Pricing* to calculate their effect on reducing CO2 emissions and energy consumption, as well as the investment cost for the amount of CO2 reduced, in the capital expenditure plans. The effectiveness and economical rationality of each project are identified from an environmental standpoint and used as information for making investment decisions.
We have implemented some of the specific reduction measures that include a switch to equipment with higher-energy efficiency, eliminating loss in energy consumption through proper operation management, and promoting the visualization of power consumption in each process. At the same time, we have expanded the use of LED lighting at all our global sites—as of end-FY2023 the ratio of LEDs as a percentage of all lights at production sites had increased to 90.4%. In FY2023, we implemented company-wide air-conditioner energy-saving measures.
We are also accelerating the introduction of renewable energy. In FY2023, solar power generation systems were expanded or newly installed at the Kubota Sakai Rinkai Plant (Japan), Siam Kubota Corporation Co., Ltd. (Thailand), Kubota Engine (Thailand) Co., Ltd., Kverneland Group Soest GmbH (Germany), Kverneland Group Ravenna S.r.l. (Italy), and elsewhere. This brought the renewable energy consumption of the entire Group to 132,287 MWh (roughly equivalent to a 69,614-ton reduction in CO2 emissions). The renewable energy usage ratio in 2023 was 15.9% , versus the 2025 target of 20%.
As a result of the efforts toward achieving the Medium-Term Environmental Conservation Targets 2025 for CO2 reduction, global production sites achieved a reduction of 9.9 kilotons CO2e in FY2023
compared with the case where countermeasures were not implemented from the previous year. The economic effects of these measures reached 260 million yen compared to the previous year.
CO2 emissions per unit of production in FY2023 improved by 46.6% compared to the base year (FY2014).
We will continue to implement measures to save energy on production equipment and air-conditioning/lighting, as well as promote measures to reduce waste and loss in the use of energy based on the concept of the Kubota Production System (KPS) and expand the use of renewable energy.
- Refers to the placing of an internal monetary value on carbon by an organization
-

Solar panels capable of generating 1,566 kW of power were installed at the Kubota Global Institute of Technology (Japan), a facility that opened in September 2022.
-
CO2 Emissions by Region
-
CO2 Emissions by Business
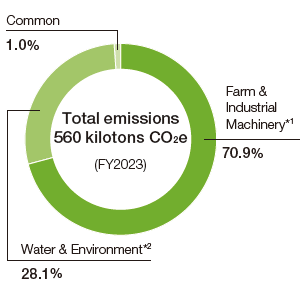
- *1.CO2 emissions generated from the production of products such as agricultural machinery, construction machinery, and engines.
- *2.CO2 emissions generated from the production of products such as ductile iron pipes and cast steel.
-
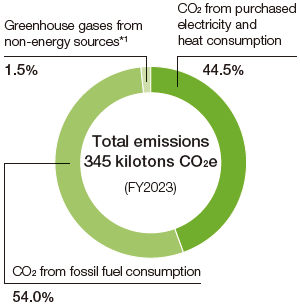
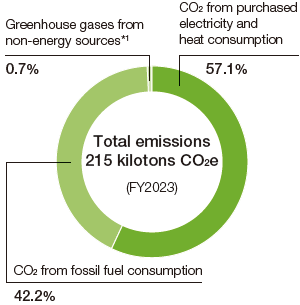
CO2 Emissions by Emission Source
-
Japan
-
Overseas
-
- *1. Greenhouse gases from non-energy sources include the following: CO2 4.2 kilotons CO2e, CH4 1.4 kilotons CO2e, N2O 0.6 kilotons CO2e, HFC 0.4 kilotons CO2e, PFC 0 kilotons CO2e, SF6 0.006 kilotons CO2e, and NF3 0 kilotons CO2e
-
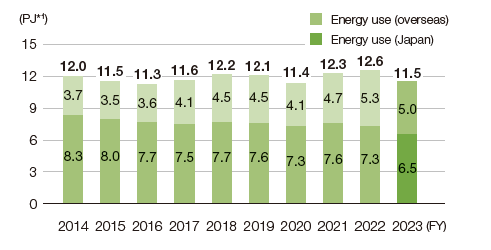
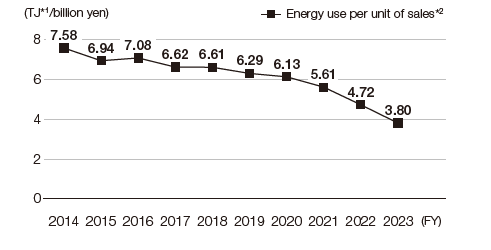
Trends in Energy Use at Business Sites and Energy Use per Unit of Sales
- *1.PJ=1015J, TJ=1012J
- *2. Energy use per unit of consolidated net sales. The Kubota Group adopted International Financial Reporting Standards (IFRS) instead of accounting principles generally accepted in the United States of America from FY2018.
3. CO2 Emissions throughout the Value Chain
The Kubota Group makes concerted efforts to figure out CO2 emissions throughout the value chain in addition to its business sites. Following guidelines*, we calculate CO2 emissions based on Scope 3, and continue to expand the categories in the Scope of its calculation of CO2 emissions.
- Basic Guidelines on Accounting for Greenhouse Gas Emissions Throughout the Supply Chain issued by the Japanese Ministry of the Environment and Ministry of Economy, Trade and Industry
-
CO2 Emissions in Each Stage of Value Chain
ClassificationScope of calculation CO2 emissions (kilotons CO2e)*3 2021 2022 2023 Emissions of the Kubota Group’s business sites Direct emissions (Scope 1)*1 Use of fossil fuels 303 295 277 Non-energy-derived greenhouse gas emissions 6 7 7 Indirect emissions (Scope 2)*1 Purchased electricity and heat use 304 283 276 Upstream and Downstream emissions Other indirect emissions (Scope 3) Category 1 Resource extraction, manufacturing and transportation related to purchased goods/services 3,732 4,104 4,191 2 Manufacturing and transportation of capital goods such as purchased equipment 406 567 492 3 Resource extraction, manufacturing and transportation
related to purchased fuels/energy112 111 108 4 Upstream transportation and distribution 285 282 246 5 Disposal of wastes discharged from business sites 31 31 28 6 Employee business travels 11 19 28 7 Employee commuting 10 10 17 8 Operation of assets leased to the Kubota Group 0*4 0*4 0*4 9 Downstream transportation and distribution 0 0 0 10 Processing of intermediate products*2 342 346 338 11 Use of sold products*2 28,133 36,951 36,787 12 End-of-life treatment of sold products 61 68 69 13 Operation of assets leased to other entities 0*4 0*4 0*4 14 Operation of franchises 0*4 0*4 0*4 15 Investments 0*4 0*4 0*4 Total of Scope 3 33,174 42,489 42,306 Total of Scopes 1, 2, and 3 33,787 43,074 42,866 - *1. CO2 emissions refers to emissions from all Kubota Group sites (100%).
- *2. From FY2023, the boundary of products subject to calculations was changed. This change has been applied retroactively to previous years.
- *3. Totals shown may differ from the simple sum of values shown due to rounding.
- *4. CO2 emissions are indicated as zero (0) because there are no applicable activities or the impact is extremely low.
Adaptation to Climate Change
1. Measures to Adapt to Climate Change
It is likely that the progression of climate change will have a negative impact on our lives. For example, the frequent occurrence of weather disasters, changes in agricultural practices, and an increase in the number of heat stroke cases. Our response to climate change needs to include ongoing measures aimed at reducing greenhouse gas emissions, as well as policies for avoiding or reducing damage brought on by climate change.
As part of its strategy to adapt to climate change, the Kubota Group is implementing a number of initiatives at its business sites and in its products and services.
| Category | Major initiatives |
|
|---|---|---|
| Food |
|
|
| Water | Flooding |
|
| Drought |
|
|
| Management systems |
|
|
| Living environment |
|
|
Provision of Farm Water Management System WATARAS
WATARAS is a farm water management system that allows users to remotely and automatically control water flowing in and out of rice paddies while monitoring water levels on a smartphone or PC.
So-called “smart rice paddy dam” demonstrations are underway in which rice paddies are temporarily made to fill up with rainwater by remotely raising the drainage level setting when rivers are at risk of flooding during heavy rainfall. These “rice paddy dams” have the potential to help prevent flooding.
-

Overview of WATARAS-managed “smart rice paddy dam”
■ Initiatives taken at Business Sites
Typhoons and pouring rain can affect production equipment and distribution. We have formulated BCP measures and disaster response manuals and we continue to take steps to prevent any holdups or delays in business activity even during weather disasters. Alongside seismic retrofitting, our BCP measures include steps taken to minimize the impact of torrential downpours on buildings and the protection of power supply equipment from flooding. To be prepared for high tides and torrential rain, the sites have also installed sump pumps, hold emergency drills, and are equipped with water tanks for use during water shortages.
